
A factory performance scorecard helps manufacturers track key metrics like quality, delivery, cost, and efficiency in real-time. By focusing on the right data, it turns insights into actionable steps to improve production. Here’s how to create one:
- Identify Key Metrics: Choose 4-5 KPIs that align with your goals, such as First Pass Yield (FPY), On-Time Delivery (OTD), and Factory Efficiency %.
- Organize Metrics: Use frameworks like SQDCME (Safety, Quality, Delivery, Cost, Morale, Environment) or Balanced Scorecard perspectives (Financial, Customer, Internal Process, Learning & Growth).
- Automate Data Collection: Use tools like ERP or MES systems to ensure accurate, real-time data.
- Review Regularly: Monitor performance daily, weekly, and monthly to spot trends and adjust goals.
- Simplify Reporting: Keep scorecards focused with no more than 9 top-level metrics, and make results visible to all teams.
This approach ensures your factory runs efficiently, reduces waste, and meets customer demands effectively.
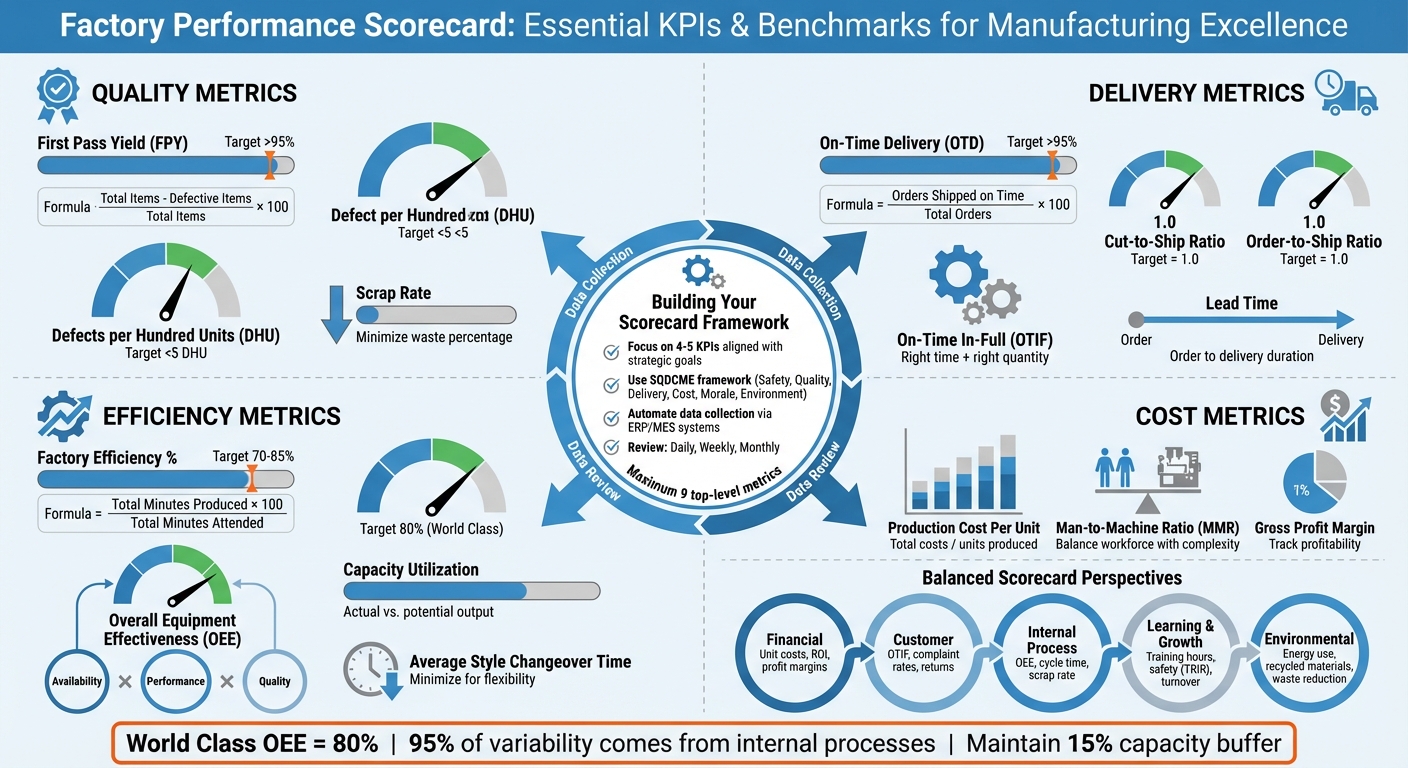
Factory Performance Scorecard KPI Framework and Benchmarks
Manufacturing KPI Scorecard in Excel
sbb-itb-8dbc09a
Selecting Key Performance Indicators (KPIs)
When it comes to turning production data into actionable insights, picking the right KPIs is absolutely essential. These metrics are the backbone of your scorecard, transforming it from a simple data repository into a powerful decision-making tool. Start by identifying what matters most to your business – whether it’s improving product quality, reducing lead times, or cutting costs. To keep things manageable, focus on four to five KPIs that align with your strategic goals. The QDISC framework – Quality, Delivery, Inventory, Safety, and Cost – is a great starting point. This approach prioritizes safety and quality before diving into financial considerations, ensuring operational integrity stays front and center.
For activewear manufacturers, it’s all about tailoring your KPIs to the unique demands of the industry. Capital-intensive operations, for instance, should zero in on equipment metrics like Overall Equipment Effectiveness (OEE). Meanwhile, labor-heavy processes, common in garment production, should emphasize safety and workforce productivity. As Rick Rosser, CEO of Phoenix Lighting, aptly puts it:
"The biggest issue we share with leaders is to focus on what matters… Our team must understand the difference between ‘be good’ and to ‘look good.’ With KPIs, we strive for data-driven proof we are good."
Now, let’s break down the key metrics by category.
Quality Metrics
Start with quality – it’s the foundation of any manufacturing process. Quality metrics measure how often your factory gets it right the first time. A key metric here is Right First Time (RFT), also known as First Pass Yield (FPY), which calculates the percentage of garments passing inspection without needing rework. The formula is simple:
(Total Items Produced – Defective Items) / Total Items Produced.
A high FPY means fewer rework costs and smoother production flow.
Another critical metric is Defects per Hundred Units (DHU), which tracks quality performance at the department level, such as Cutting, Sewing, and Finishing. For example, if your Sewing department shows a DHU of 15 while Finishing is at 5, it’s clear where improvements are needed. Additionally, Scrap Rate – the percentage of unusable materials generated during production – affects both material costs and waste reduction goals.
Delivery Metrics
Delivery metrics gauge your ability to meet deadlines and fulfill orders. On-Time Delivery (OTD) measures the percentage of orders shipped on or before the promised date, calculated as:
(Orders Shipped on Time / Total Orders Shipped) × 100.
For a more stringent measure, On-Time In-Full (OTIF) evaluates whether orders are delivered both on time and in the correct quantities. Another critical delivery metric in garment manufacturing is the Order-to-Ship Ratio, which should always be 1, ensuring buyers receive exactly what they ordered. Similarly, the Cut-to-Ship Ratio compares the quantity cut to the quantity shipped, with a target of 1 to minimize surplus and waste. Finally, Lead Time – the total time from order placement to delivery – reflects your factory’s responsiveness and customer satisfaction.
Cost and Efficiency Metrics
Efficiency and cost metrics offer a clear picture of how well resources are being utilized. Factory Efficiency % is calculated as:
(Total Minutes Produced × 100) / Total Minutes Attended by Direct Labor.
This metric is key for understanding labor productivity and planning capacity.
Overall Equipment Effectiveness (OEE) combines Availability, Performance, and Quality into a single score. While hitting 100% is ideal, a score of 80% is considered "World Class". Meanwhile, Production Cost Per Unit divides total manufacturing costs (materials, labor, overhead) by the number of units produced, giving you a snapshot of per-garment profitability. Capacity Utilization, which measures actual output against potential output, helps pinpoint underused resources.
For garment-specific operations, metrics like the Man-to-Machine Ratio (MMR) – total workforce divided by active sewing machines – are important for balancing labor with product complexity. Another key metric is Average Style Changeover Time, which tracks the time it takes to switch from finishing one style to starting another. Shorter changeover times indicate greater flexibility and efficiency, especially useful for activewear factories managing frequent design updates.
| KPI Category | Metric | What It Measures | Target/Benchmark |
|---|---|---|---|
| Quality | First Pass Yield (FPY) | % of garments passing inspection without rework | >95% |
| Quality | Defects per Hundred Units (DHU) | Quality level by department | <5 DHU |
| Delivery | On-Time Delivery (OTD) | % of orders shipped on schedule | >95% |
| Delivery | Cut-to-Ship Ratio | Controls surplus and waste | 1.0 |
| Efficiency | Factory Efficiency % | Labor productivity | 70–85% |
| Efficiency | Overall Equipment Effectiveness (OEE) | Equipment utilization | 80% (World Class) |
| Cost | Production Cost Per Unit | Total cost per garment | Varies by product |
Designing the Scorecard Framework
Organizing your KPIs into a structured framework can help paint a complete picture of factory performance. New Dong Huang Garment Co., Ltd. demonstrates how effective frameworks align everyday operations with broader strategic goals. A well-thought-out scorecard links metrics to business objectives, bridging the gap between daily activities and long-term ambitions.
Using Balanced Scorecard Perspectives
The Balanced Scorecard method categorizes metrics into four or five areas, ensuring you’re not overly focused on financial results while ignoring other critical aspects. For activewear manufacturing, this approach offers a well-rounded view of factory performance.
- Financial Perspective: Tracks profitability and cost efficiency, focusing on metrics like gross profit margins and unit production costs.
- Customer Perspective: Measures performance from the buyer’s perspective, using KPIs such as On-Time In-Full (OTIF) delivery rates, customer complaints, and reasons for returns.
- Internal Process Perspective: Monitors the efficiency and quality of manufacturing processes, with metrics like cycle time, scrap rate, and first-pass yield.
- Learning and Growth Perspective: Highlights the importance of workforce development and innovation, tracking indicators like employee training hours, safety incident rates (TRIR), and employee engagement.
- Environmental Perspective (optional): Focuses on sustainability, measuring energy use, greenhouse gas emissions, and reliance on recycled materials.
Here’s how these perspectives translate into actionable metrics:
| Perspective | Objective | Example KPIs |
|---|---|---|
| Financial | Reduce production overhead | Unit Production Cost, Gross Profit Margin, ROI |
| Customer | Ensure brand satisfaction | OTIF, Customer Complaint Rate, Return Reasons |
| Internal Process | Optimize production flow | OEE, Cycle Time, Changeover Time, Scrap Rate |
| Learning & Growth | Maintain a skilled workforce | Training Hours, TRIR, Employee Turnover |
| Environmental | Support sustainability efforts | Energy Mix, % Non-Virgin Materials, Waste Reduction Rate |
To keep things manageable, limit your scorecard to a maximum of nine top-level metrics. As Stuart Kinsey, Co-founder of SimpleKPI, explains:
"Embracing KPIs and visualizing performance is essential for any organization to thrive and grow".
This framework ensures that your KPIs align with strategic goals, creating a clear connection between operational data and long-term objectives.
Building a KPI Hierarchy
A KPI hierarchy, sometimes called a KPI tree, connects high-level business goals to the operational metrics that drive them. This structure ensures that every data point collected serves a strategic purpose, turning raw numbers into meaningful insights.
- Level 1: Comprehensive KPIs: These are the headline figures, like Overall Equipment Effectiveness (OEE) or Total Throughput.
- Level 2: Basic KPIs: These break down Level 1 metrics into specific components. For example, OEE can be divided into Availability, Technical Efficiency, and Quality Rate.
- Level 3: Supporting Elements: These are the granular data points tracked on the factory floor, such as Planned Operation Time, Good Quantity, and Scrap Quantity.
For example, if your strategic goal is to "Increase Reliability", your Level 1 KPI could be On-Time Delivery Rate. Level 2 metrics might include machine uptime and production schedule adherence, while Level 3 focuses on details like maintenance schedules and operator efficiency.
It’s crucial to ensure that each level supports the one above it, creating clear causal links. Assign ownership for each KPI to ensure accountability, and specify data sources – whether from ERP systems, CRM tools, or factory floor sensors – to avoid confusion. Balance leading indicators (like "Near Miss Awareness") with lagging indicators (such as "Defect Rate") for a complete performance view.
This hierarchy forms the backbone of your scorecard, ensuring every metric contributes to achieving your strategic goals.
Weighted Scoring for Overall Evaluation
Adding a weighted scoring system refines your evaluation process, turning multiple KPIs into a single, actionable performance score. This method prioritizes what matters most to your business while still keeping secondary metrics in view.
First, assign weights to each perspective based on your strategic priorities. For instance, if quality is your primary focus, you might allocate 35% of the total score to the Internal Process perspective, 25% to Customer, 20% to Financial, 15% to Learning and Growth, and 5% to Environmental.
Next, assign weights to individual KPIs within each perspective. For example, if the Internal Process perspective accounts for 35%, you might allocate 15% to OEE, 10% to Scrap Rate, and 10% to Cycle Time. The goal is to reflect the strategic importance of each metric accurately.
To calculate overall performance, multiply each KPI’s weight by its performance percentage, producing a single score on a 0–100 scale. For instance, OEE is calculated as Availability × Performance × Quality, providing a weighted view of equipment health. A "World Class" OEE score is typically around 80%.
Set a regular reporting schedule – usually monthly – to identify trends and address potential issues early. As your business evolves, refine metrics and weights to stay aligned with your goals.
Implementing Data Collection and Tools
To make your scorecard framework truly effective, it needs to be backed by reliable data systems. In today’s manufacturing world, real-time data is the backbone of operations. Automating data collection as much as possible ensures accuracy, while clear procedures are necessary for any metrics that still require manual input.
Data Sources and Validation
The foundation of an accurate scorecard lies in connecting to the right data sources. Enterprise Resource Planning (ERP) systems act as a centralized hub, integrating information from sales, procurement, and production processes for real-time analysis. On the shop floor, systems like Manufacturing Execution Systems (MES), Enterprise Asset Management (EAM), and Supervisory Control and Data Acquisition (SCADA) provide automated data directly from production equipment.
By integrating machinery through PLC and OPC, you can significantly reduce delays and errors. Additionally, Industrial Internet of Things (IIoT) devices and RFID tags track products in real time as they move through your operations. This level of automation not only improves accuracy but also slashes costs associated with downtime.
Each KPI should have a clearly defined data source and strict protocols to eliminate ambiguity. Bill Ferrin, Director of Information Technology at Portacool LLC, highlights the importance of this approach:
"The only way to survive and be successful in this market is to have visibility into the KPIs to drive manufacturing, maintain profitability, drive customer satisfaction and quality".
Modern ERP systems go a step further by incorporating AI capabilities to detect anomalies that might escape human operators.
For data that remains manual – such as customer complaints or specific quality checks – rigorous protocols are essential. Always maintain a centralized working copy of your data, along with an unaltered backup, to avoid inconsistencies or outdated information.
With validated data sources in place, you’re ready to automate your scorecard for maximum efficiency.
Scorecard Templates and Automation
If you’re running a smaller operation, starting with Excel templates is a practical first step. These templates often include heatmaps that visually highlight performance levels, making it easy to track KPIs manually. However, as your operations grow, manual methods can quickly become inefficient.
Tools like Microsoft Power BI take things to the next level by turning raw data into interactive visualizations and predictive insights. The trend is moving away from static dashboards toward AI-enhanced "Liveboards", which allow for natural language queries and offer real-time, drillable insights. These systems can even send automatic alerts when a KPI dips below expected levels, helping teams address problems before they escalate.
When automating your scorecard, the goal is to establish a smooth data pipeline. Information should flow seamlessly from transactional databases to an Enterprise Performance Management (EPM) warehouse, where it can be transformed and populated into reporting tables. This setup ensures your scorecard updates automatically as fresh data comes in.
It’s also important to keep your dashboard focused. Experts suggest limiting it to five to 10 KPIs to avoid information overload or what some refer to as "terminal confusion".
Monitoring, Reviewing, and Improving Performance
Keeping an effective factory scorecard requires consistent monitoring, regular reviews, and timely adjustments to ensure everything runs smoothly.
Establishing Regular Review Cycles
A scorecard is only useful if it’s reviewed regularly and teams are held accountable for results. The best practice involves a tiered review system that aligns with the urgency of specific metrics. For example, in apparel manufacturing, metrics like jobs per hour and rejection rates should be checked hourly. This allows teams to quickly address bottlenecks and maintain production flow.
Daily reviews, often held during short morning "sunrise" meetings (10–15 minutes), focus on three essential questions: "How well did we do yesterday?", "What are today’s targets?", and "Who will do what and when?". Weekly reviews take a broader look, focusing on cost-related metrics such as labor hours per unit and audit results like 5S scores. This layered approach ensures critical metrics are addressed promptly without overwhelming teams with unnecessary meetings.
Transparency plays a key role here. Robert S. Kaplan and David P. Norton, creators of the Balanced Scorecard framework, emphasize:
"What you measure is what you get. Senior executives understand that their organization’s measurement system strongly affects the behavior of managers and employees."
To encourage accountability and quick problem-solving, display scorecard dashboards prominently on the shop floor. This keeps everyone – from operators to senior leaders – informed and engaged in solving issues as they arise. The combination of regular reviews and visible metrics helps identify trends early and fosters a culture of continuous improvement.
Spotting Trends and Driving Improvements
The real strength of a scorecard lies in its ability to highlight trends before they become major issues. By tracking both leading indicators (e.g., cycle time) and lagging indicators (e.g., daily production volume), you can anticipate problems and take corrective action.
One critical metric to watch is First Time Through (FTT%), which measures how often products move through stages like Cutting, Sewing, and Finishing without needing rework. For example, if each stage achieves a 90% FTT, only 72.9% of products pass through the process without rework, revealing where inefficiencies are costing time and resources.
Another key ratio is Work in Progress (WIP) to Standard Work in Progress (SWIP). A WIP-to-SWIP ratio above 1 indicates overproduction, while a ratio below 1 points to potential system starvation or cycle time issues. Safety metrics are equally important. Studies show that for every 300 no-injury "near miss" incidents, one serious injury typically occurs. Using tools like a Safety Cross – where green marks accident-free days and red flags incidents – helps track and prevent accidents. Spotting these trends early ensures timely adjustments and smoother operations.
Adjusting Targets for Changing Needs
As market demands and business conditions shift, scorecard targets must adapt. Takt Time (calculated as Available Production Time divided by Customer Demand) is a key metric for adjusting hourly production goals when orders increase or decrease significantly. By recalculating Takt Time, you can set new jobs-per-hour targets that align with current demand.
While achieving 100% Overall Equipment Effectiveness (OEE) is theoretically possible, an OEE between 80% and 85% is considered "World Class" for apparel manufacturing equipment like overlockers. Interestingly, over 95% of production variability usually stems from internal processes rather than external factors like raw material supply. This means most improvements depend on refining internal workflows.
To manage fluctuations effectively, maintain a 15% capacity buffer to absorb variations in demand and performance. If capacity exceeds 85%, consider expanding resources or adjusting delivery schedules. Well-trained teams should aim to keep production variability within ±5% over 10 runs. Quarterly reviews can help identify whether targets need recalibration or if additional training is necessary. Regularly updating targets ensures your operations stay efficient and performance-driven.
Conclusion
A factory performance scorecard turns raw data into actionable steps for improvement. By focusing on the right KPIs, creating a balanced structure, and setting up regular review cycles, manufacturers gain the clarity needed to make quick, informed decisions. The principles shared in this guide provide a clear path for putting these ideas into practice.
Take New Dong Huang Garment Co., Ltd. as an example. They use the scorecard to align key metrics – like quality, delivery, and cost – with their strategic goals. This ensures steady performance across production lines. The scorecard also brings transparency, making it easier to spot problems early, whether it’s a dip in First Time Through rates or a bottleneck slowing hourly production.
Here’s the essence of the framework: focus on 4–5 critical metrics per level, automate data collection, and make the results visible on the shop floor. This approach removes subjective opinions about performance and keeps everyone working toward shared goals. Most performance improvements come from refining internal processes, putting control firmly in the hands of manufacturers.
Regular reviews help adjust targets as market demands shift. For instance, recalculating Takt Time for new order volumes or updating goals during quarterly evaluations ensures the scorecard evolves with your business. This adaptability allows manufacturers to stay competitive while consistently meeting the high standards of quality and on-time delivery expected by global brands.
FAQs
How can I select the best KPIs for my factory’s performance scorecard?
To choose the right KPIs for your factory’s performance scorecard, focus on metrics that directly tie to your business goals and operational needs. Start by pinpointing key areas like production efficiency, product quality, supply chain performance, and workplace safety. From there, select measurable metrics within these categories that offer actionable insights and help drive your objectives forward.
Keep your scorecard straightforward by concentrating on a few key KPIs that matter most to your factory’s success. This prevents information overload and makes it easier to track performance. A balanced approach works best – consider metrics that reflect financial results, internal processes, customer satisfaction, and growth opportunities. Don’t forget to revisit and refine your KPIs regularly to ensure they align with shifting goals and support ongoing improvement.
What are the best tools to automate data collection for a factory performance scorecard?
Streamlining data collection for a factory performance scorecard can save time and ensure your metrics stay current. For straightforward setups, tools like Excel or Google Sheets are excellent options. By integrating automated data feeds or using scripts, you can track key performance indicators (KPIs) with ease. These tools are widely accessible and offer plenty of flexibility for small to medium-sized businesses.
If your needs are more complex, Power BI is a strong choice. It allows seamless connections to manufacturing data sources and can refresh scorecards automatically. Additionally, specialized manufacturing software often comes with built-in features for data entry, analysis, and visualization, making the process even smoother.
Automating this workflow not only keeps your performance data accurate but also enables faster, more informed decision-making.
How often should I review and update my factory performance scorecard?
To ensure your factory’s performance scorecard stays relevant and effective, it’s important to review and update it on a regular basis. Ideally, key performance metrics should be checked frequently – daily or even hourly. This kind of consistent monitoring helps you catch potential issues early and make adjustments in real time, keeping operations running smoothly and driving ongoing improvements.
Frequent updates also ensure the scorecard remains accurate and aligned with your factory’s current goals and processes. The frequency of these reviews might depend on the size and complexity of your operation, but the main takeaway is to stay proactive. Keeping a close eye on performance metrics is essential for maintaining efficiency and achieving long-term success.